edgeSV is the equipment health brand of NTEK System Co., Ltd. ntek@nteksys.com
edgeSV
Request a demo
Overview

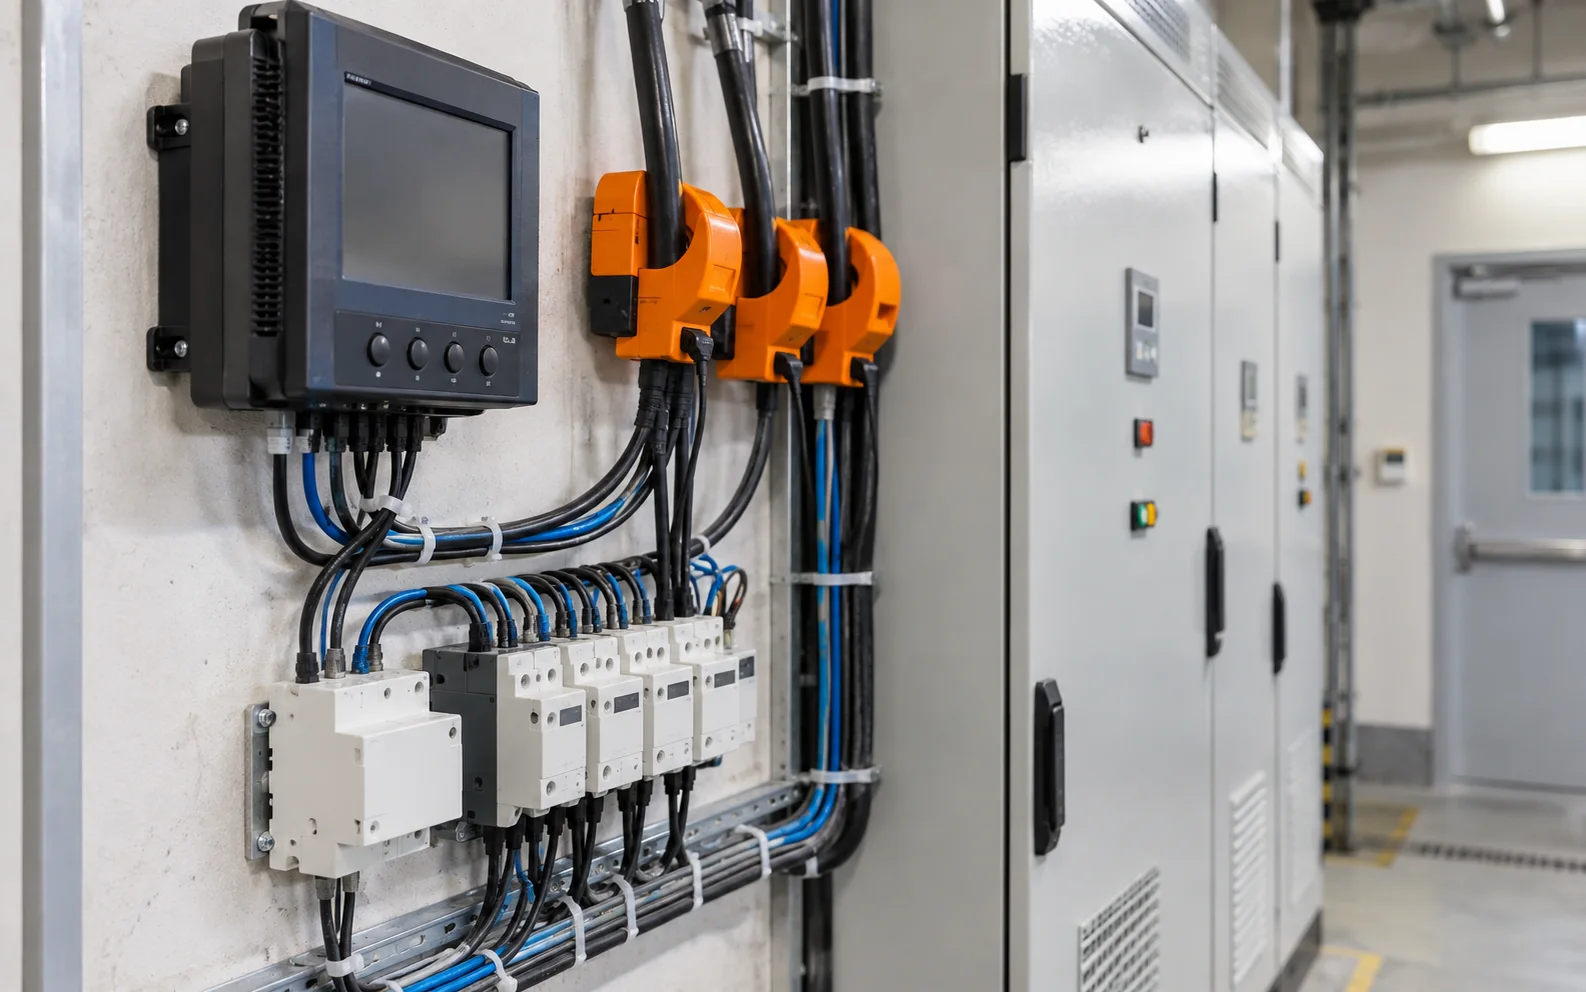
Pumps and blowers driven by VFDs can trip because of power disturbances. In this scenario SV500 measures the three-phase voltage and current of pumps and blowers to monitor power quality and motor and VFD condition together.

Target equipment
Inflow pumpsAeration blowersVFD

Operating challenges

Power disturbances can lead to the shutdown of treatment equipment.

01

Power disturbances and VFD trips

At the Commerce Township wastewater treatment plant in Michigan, USA, frequent power disturbances after VFDs were installed forced operators to reset process equipment manually, resulting in several hours of unplanned shutdown and damage to two VFDs.

02

Difficulty identifying the cause

Only after installing a voltage monitor did the same plant confirm that the timing of voltage disturbances matched the VFD overvoltage trips, and it used this data in discussions with the utility.

What SV500 detects

SV500 analyzes power quality in real time from the voltage and current signals of pumps and blowers and, with ESA, also diagnoses the condition of motors and VFDs.

01

Power quality monitoring

Analyzes voltage sag/swell, total harmonic distortion (THD) and voltage and current imbalance in real time to identify equipment impact and abnormal conditions caused by poor power quality at an early stage.

02

Power and energy measurement

Measures active, reactive and apparent power, power factor and energy, viewable on the dashboard.

03

VFD operation diagnosis

For equipment driven by a VFD, SV500 analyzes voltage, current and frequency signals on the VFD secondary (output) side at 8 kHz to predict and diagnose potential faults.

04

Motor and drive diagnosis

Detects mechanical unbalance, bearing problems, shaft misalignment, winding insulation degradation, ground leakage current and load-related problems.

05

Adaptive thresholds

Machine learning learns the normal state of each asset and judges condition with thresholds that adapt to load. Criteria matched to each asset and load condition are applied instead of fixed thresholds.

06

Web dashboard and data integration

The equipment web server dashboard shows status per diagnostic parameter in real time, so condition can be checked without a site visit, and data can be integrated with upper-level systems over Modbus RTU, Modbus TCP, MQTT and RESTful API.

Benefits

Power quality events and equipment condition can be recorded together so abnormalities can be handled in advance.

01

Early detection of potential failures

Detects potential failures early to minimize unexpected incidents and risk.

02

Optimized maintenance schedules

Diagnostic data helps predict and optimize maintenance schedules.

03

Lower cost and downtime

Higher operating efficiency helps reduce energy consumption, maintenance cost and downtime.

Operational Impact of edgeSV

Continuous monitoring and early detection support availability, maintenance and energy efficiency.

20~40% Reduction in unplanned downtime
10~25% Maintenance cost savings
5~15% Energy savings
10~20% Longer equipment life

Illustrative ranges, not verified SV500 results. Actual outcomes depend on site conditions and corrective actions; PoC validation is required.

Which asset comes first?

Name the one that matters most and we will set out the diagnostics and measurement points for it.

Request a demo