
01
Load visibility by rack row
Because of location and operating conditions, rounds miss continuous changes; remote trends and event records are needed.
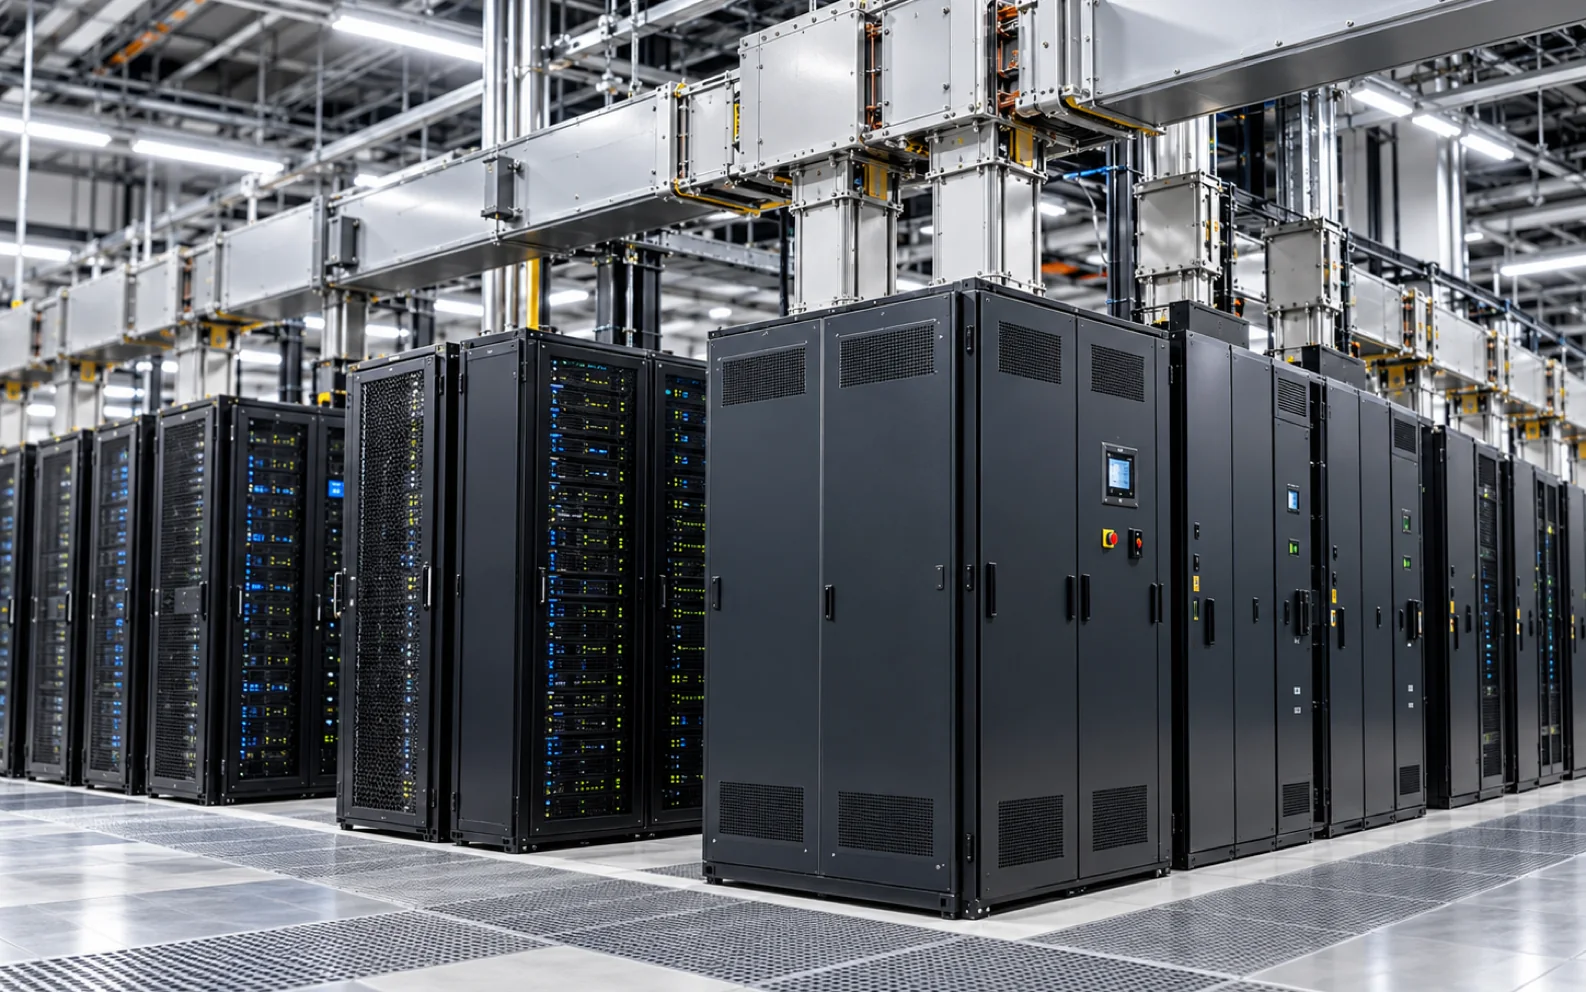
Loading and quality on distribution feeders are monitored down to the rack row.
PDUs and busways distribute power to server racks. SV500 uses voltage and current signals at each feeder to record per-phase load and power quality, supporting capacity planning and screening for abnormal loading.
Rack-row feeders change load quickly, and periodic rounds can easily miss those changes.
Because of location and operating conditions, rounds miss continuous changes; remote trends and event records are needed.
Phase imbalance and power-quality degradation affect feeder reliability, so they need to be recorded continuously.
SV500 analyzes feeder voltage, current and power signals to record load and quality.
Records current and power per rack-row feeder. What is visible depends on the metering point, so confirm it on the single-line diagram first.
Compares per-phase current to find circuits skewed to one phase, as a basis for adjusting rack layout and phase allocation.
Logs voltage events and overcurrent with timestamps. Interpretation depends on whether metering is upstream or downstream of the UPS.
Machine learning learns each asset's normal condition and judges its status with load-dependent adaptive thresholds, rather than fixed limits.
Check diagnostic status in real time on the device's built-in web dashboard without a site visit, and connect to higher-level systems such as BMS or SCADA over Modbus TCP/RTU. Additional interfaces such as MQTT depend on the project configuration.
Feeder-level load trends give a factual basis for expansion, rebalancing and maintenance order.
Records peak load, peak time and usage versus rating for each feeder.
Finds circuits with repeated peaks so rack layout and phase allocation can be adjusted.
Compares health grades on one basis to set the inspection order.
SV500 records per-phase current and peak load on rack-row feeders to support capacity planning. Connection temperature, bolt tightness and insulation aging still need separate thermal, torque and insulation checks.
Name the one that matters most and we will set out the diagnostics and measurement points for it.
Request a demo